Economics Chapter 3 Supply and Demand Practice Quiz
Q1. In economics, the demand for a good refers to the amount of the good that people:
- would like to have if the good were free.
- will buy at various prices.
- need to achieve a minimum standard of living.
- will buy at alternative income levels.
Q2. Refer to Figure 3-1. Using the graph above and beginning on D1, a shift to D2 would indicate a(n):
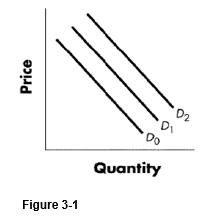
- increase in quantity demanded.
- decrease in quantity demanded.
- increase in demand.
- decrease in demand.
Q3. Refer to Figure 3-3. A change from Point A to Point B represents a(n):
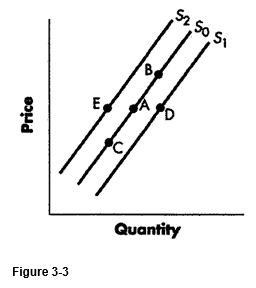
- increase in supply.
- decrease in supply.
- increase in quantity supplied.
- decrease in quantity supplied.
Q4. If an increase in the price of Good X causes a decrease in the demand for Good Y, we can conclude that:
- the price of Good Y will increase.
- Goods X and Y are normal goods.
- Goods X and Y are substitute goods.
- Goods X and Y are complement goods.
Q5. According to the table and graph above, if the price fell from $4 to $3 what will be the new quantity demanded if the demand curve remains linear after the shift of the demand curve to the left? 30 (with margin: 0) and 0 (with margin: 0)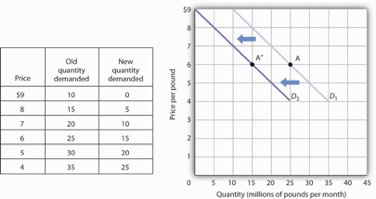
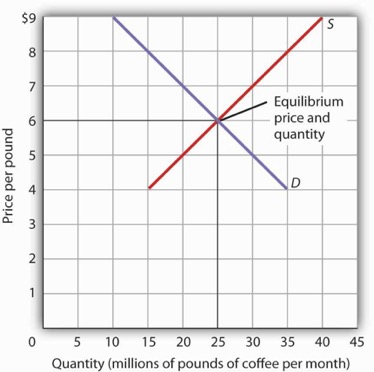
Q6. Referring to the graph above which price would result in a surplus of 20 million pounds of coffee per month? (Enter a numerical answer only with no “$” symbol) 8 (with margin: 0) and 0 (with margin: 0)
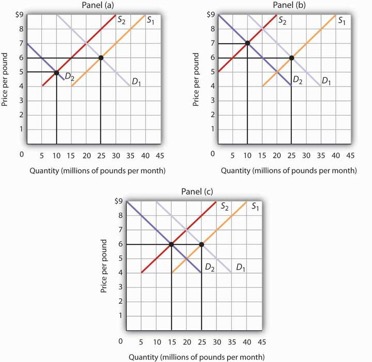
Q7. According to panel (C), where would the equilibrium quantity settle after the demand and supply curves move from D1 to D2 and S1 to S2? 25 (with margin: 0) and 0 (with margin: 0)
Q8. According to the graphs above, which of the panels represent the case where the price of a complementary good has increased?
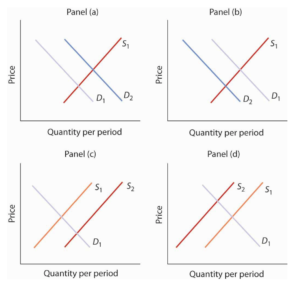
- Panel A
- Panel B
- Panel C
- Panel D
Q9. Which of the following could explain the shift of the supply curve depicted above from S1 to S2?
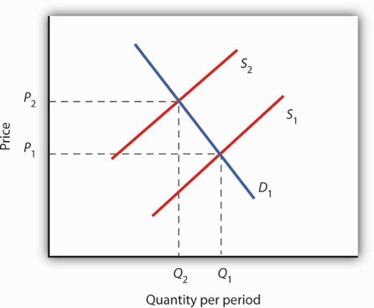
- A decline in the number of consumers purchasing this product.
- A rise in the price of a substitute good.
- Firms exiting the industry.
- A fall in the cost of production.
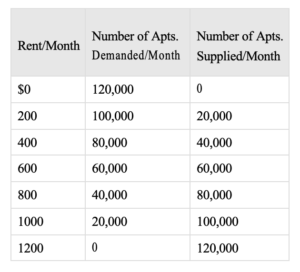
Q10. Assume that the table above represents the market for apartments. What would be the excess demand for apartments if the government imposed a price ceiling of $800? (Only provide a numerical answer with no comma) 0 (with margin: 0)
Author: Ask Assignment Help
Connect with Ask Assignment Help for urgent assignment help, online exam help, dissertation writing service & online coursework help for all subjects. Order now to get 25% off on all assignments now.