Home » Online Exam Help » Statistics Assignment Help » Harvard Quantitative Methods Final Assessment Test 1 2021
Harvard Quantitative Methods Final Assessment Test 1 2021
Q1. A regression analysis of 35 homes represented by Ravenweyr Realty yielded the following prediction equation. Price = –32,526 – 617 * Time_To_Subway + 214 * Size where Price is the selling price in US dollars, Time_To_Subway is measured in minutes, and Size is interior floor space in square feet. Which statement is the best interpretation of the coefficient “–617”?
- On average, the selling price decreases by $617 for each minute of distance to the subway, when controlling for house size.
- On average, the selling price decreases by $617 for each minute of distance to the subway, when not controlling for house size.
- On average, the selling price increases by $617 for each minute of distance to the subway, when controlling for house size.
- On average, the selling price increases by $617 for each minute of distance to the subway, when not controlling for house size.
Q2. The regression output shown below describes the relationship between sales of Red Banjo Pumpkin Spice Ale (PSA), the corresponding month’s advertising costs of the PSA promotion (PSA Ads), and previous month’s ad costs (Lagged PSA Ads).
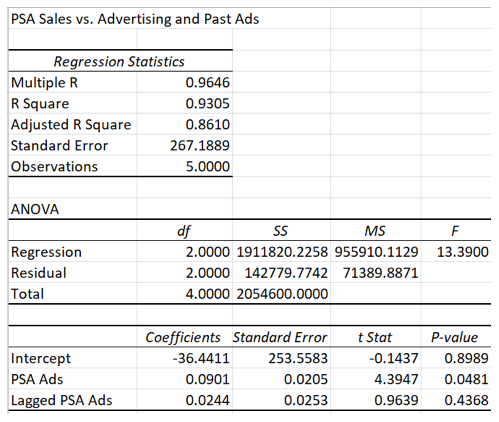
Which of the following statements is not true?
- There is a positive association between current month advertising and PSA sales
- Variability in both the independent variables explains 93% of the variation in PSA sales.
- The coefficient of the “Intercept” is not statistically significant.
- The lagged variable provides statistically significant information for predicting PSA sales
Q3. In its promotional materials, Addams University claims that its entering class has the highest SAT scores of any schools in their region. A marketing firm working for neighboring Erewhon College obtains summary statistics to test the hypothesis that the average SAT scores for students entering the two schools are different. They find a sample difference
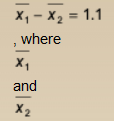
represent the mean SAT scores for students of Addams and Erewhon, respectively. The two-sided hypothesis test yields a P-value of 0.6252. At the 0.05 significance level, which of the following is true?
- The data do not support rejecting the null hypothesis.
- The difference between the two schools is not statistically significant.
- It is plausible that there is no difference at all between the two schools
- The difference between the schools is small, but statistically significant.
Q4. The marketing manager at FlatCola Cybersystems analyzed the relationship between the company’s advertising expenditures and its gross sales for a period of several months, and determined the regression equation Sales = 684,402 + 84.623*Advertising, where both Sales and Advertising are measured in dollars. Which of the following is not a reasonable conclusion to draw from the regression equation?
- For each additional dollar spent on advertising, FlatCola can expect an average of $84.62 in additional sales.
- For each thousand additional dollars spent on advertising, FlatCola can expect an average of $84,623 in additional sales.
- For each additional dollar spent on advertising, FlatCola can expect an average increase of $684,402 in additional sales
- There is a positive relationship between advertising expenses and gross sales
Q5. Red Banjo Brewing is considering adding a sweet beer, Honey Ale, to its offerings. The manager is uncertain about this new venture, since sweet beers are uncommon in their area. Red Banjo is fairly confident that they can get favorable coverage from the local press. Their preliminary market analysis estimated that a wildly successful Honey Ale would bring $50,000 of profit, but the manager still has reservations. The decision tree below denotes the expected profit for “Wild Success” as the variable W.
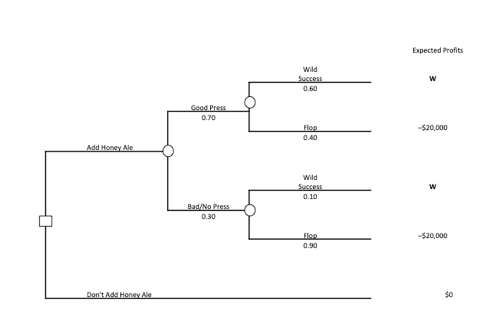
To the nearest dollar, how much profit must be associated with “Wild Success” for Red Banjo to expect a net profit from the new brew?
- W > $24,444
- W < $24,444
- W > $20,000.00
- W < $20,000.00
Q6. Which of the following statements is not true for a normal distribution?
- The curve describing the distribution is bell-shaped and symmetric.
- It is sometimes right-skewed.
- It is completely characterized by its mean and its standard deviation.
- Its mean and median are always equal.
Q7. The scatter plot and regression line below characterize the relationship between the daily high temperature (in degrees Fahrenheit) and the consumption of IPA beer (in pints) at Red Banjo Brewing.
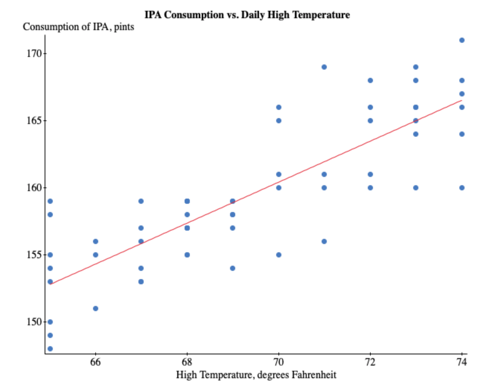
Which of the following statements define residual errors?
- The shortest (perpendicular) distances from the data points to the regression line.
- The vertical distances from the data points to the regression line.
- The shortest distance from each data point to the closest neighboring point.
- The horizontal distances from the data points to the vertical axis.
Q8. A political research firm wants to assess how favorably residents of a state view their governor. The firm created a Facebook ad aimed at all residents of the state that asks, “Do you think your governor is doing a good job?” Which of the following statements best describes the quality of the results?
- The survey is unbiased because everyone uses Facebook.
- The survey is probably biased because people who don’t live in that state will not receive the ad.
- The survey is probably biased because the response is voluntary.
- The survey is unbiased because you can count on everyone to see and read the ads that show up on Facebook.
Q9. A manager at Red Banjo Brewing has sampled 25 bottles for each of their Porter and IPA brews to determine whether they contain the advertised amounts of 12 fluid ounces and 18 fluid ounces, respectively. The data are given in the attached file data_red_banjo_brewing.xlsx. Which of the following is the best description of the mean and median amounts for the two brews? (Round your calculations to the nearest 0.1 ounce before comparing.)
- The median is greater than the mean for the Porter only.
- The median is greater than the mean for the IPA only.
- The median is greater than the mean for each brew.
- The median and the mean are about the same for each brew
Q10. The regression analysis below describes the relationship of tickets sold on weekend nights at Acme Multiplex Cinemas to a film’s Razzberries.bizz rating and the dummy variable “3-D.” When the film is being shown in 3-D, the dummy variable is 1; when it does not have a 3-D showing, the dummy variable is 0.
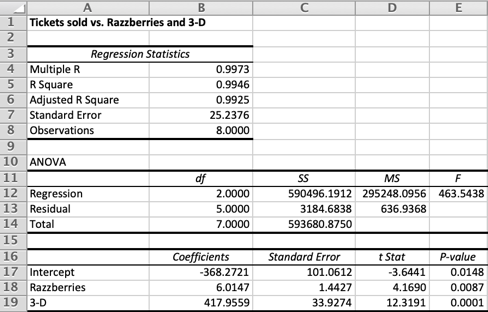
Which of the following statements can be inferred from the regression analysis?
- On average, films showing in 3-D sell about 418 more tickets than films not showing in 3-D.
- On average, films showing in 3-D sell about 6 more tickets than films not showing in 3-D
- There is no statistically significant difference in sales associated with the Razzberries.bizz rating
- There is no statistically significant difference in sales between 3-D and non-3-D movies.
Q11. A random sample of Erewhon College students was asked whether they thought the early 2020 COVID-19 quarantine restrictions were “Acceptable” or “Too strict”. The students were also asked whether they belonged to the “Wisdom” party or the “Beauty” party. The following table includes data on the number of respondents belonging to the Wisdom or Beauty parties, as well as whether the response was “Acceptable” or “Too Strict.”

What is the conditional probability (to the nearest tenth of a percent) that a student belongs to the “Wisdom” party, given that their answer was “Too Strict?”
- 45.7%
- 31.4%
- 16.0%
- 8.0%
Q12. A quality assurance manager for Red Banjo Brewing is authorized to select a sample of 25 bottles of Honey Ale and determine a 95% confidence interval for the mean volume of ale in each “12-ounce” bottle. The 25 bottles have a mean volume of 12.01 fluid ounces (fl oz), with a standard deviation of 0.10 fl oz. Which is a 95% confidence interval?
- [11.80, 12.20]
- [11.97, 12.05]
- [11.98, 12.04]
- [11.94, 12.08]
Q13. From previous experience, Red Banjo Brewing knows that its machinery produces bottles of Porter with a mean volume of 12.0 fluid ounces (fl oz) of beer. The standard deviation of the volume is 0.24 fl oz. A quality assurance engineer plans to choose a random sample of 36 bottles to verify this mean volume. If the machine is working as expected, in which interval should about 95% of the sample means lie?
- [11.52,12.48]
- [11.76, 12.24]
- [11.92, 12.08]
- [11.96, 12.04]
Q14. A regression analysis of Ravenweyr Realty’s current listings yielded the following equation Price = –32,000 – 617*Time_To_Subway + 214*Size, where Price is measured in US dollars, Time_To_Subway is measured in minutes, and Size is measured in square feet. What does the coefficient “–617” tell us about a home price?
- On average, considering houses of all sizes, the price drops by $617 for each minute of distance from the subway.
- On average, when controlling for house sizes, the price drops by $617 for each minute of distance from the subway.
- On average, considering houses of all sizes, increasing the distance to the subway by one minute increases the price of the home by $617.
- On average, when controlling for house sizes, increasing the distance to the subway by one minute increases the price of the home by $617.
Q15. A random sample of Erewhon College students was asked whether they thought the early 2020 COVID-19 quarantine restrictions were “Acceptable” or “Too strict”. The students were also asked whether they belonged to the “Wisdom” party or the “Beauty” party. The following table includes data on the number of respondents belonging to the Wisdom or Beauty parties, as well as whether the response was “Acceptable” or “Too Strict.”

Which of the following statements is true?
- The fact that a student says the quarantine was “Acceptable” tells us nothing about their party membership.
- The fact that a student belongs to the Beauty party tells us nothing about their opinion on the quarantine.
- A greater percent of students who say the quarantine was “Acceptable” belong to the Wisdom party than the percent of students who say the quarantine was “Too Strict” that belong to the Beauty party.
- Opinion on the quarantine and party membership are statistically dependent.
Q16. The Homepalooza Company wants to calculate a 95% confidence interval for the average price of a Homepalooza house. A random sample of 40 listings gives an average selling price of $330,410, with a standard deviation of $122,090. Which is a 95% confidence interval for the mean selling price?
- [$292,525, $368,245]
- [$280,686, $380,134]
- [$269,301, $391,519]
- [$266,889, $393,931]
Q17. Which of the following statements is true for standard deviation?
- The standard deviation equals the central, or “standard,” value of a data set.
- The larger the standard deviation, the more tightly the data values are grouped around the center.
- The standard deviation must be a value between –1 and 1.
- The smaller the standard deviation, the more tightly the data values are grouped around the center.
Q18. A quality assurance manager for Red Banjo Brewing needs to estimate the mean volume of beer in each bottle of IPA to within 0.05 fluid ounces (fl oz), with 99% confidence. Previous studies estimate the standard deviation of the volume is 0.31 fl oz. What is the minimum size of the sample required?
- 30 bottles
- 38 bottles
- 148 bottles
- 256 bottles
Q19. A market research consultant takes a random sample of 900 potential customers and asks whether they have a favorable impression of Ravenweyr Realty. They find 64% of the potential customers in the sample have a “somewhat favorable” or “very favorable” impression. Which of the following is a 95% confidence interval for the true proportion?
- [0.599, 0.681]
- [0.609, 0.671]
- [0.614, 0.666]
- [0.624, 0.656]
Q20. Ravenweyr Realty, Brahminton Realty, and Homepalooza are the three largest realtors in Brahminton. The attached file Data_Brahminton.xlsx gives the selling prices of the most recent listings for each firm. Based on the coefficient of variation, which firm has the most variability in selling prices?
- Brahminton Realty
- Homepalooza
- Ravenweyr Realty
- The prices of all three are equally variable
Q21. The SAT scores of first-year students entering Erewhon College are normally distributed with a mean of 1375 and a standard deviation of 98. Using the rule of thumb for a normal curve, what range contains the middle 95% of their SAT scores?
- Between 1373 and 1377
- Between 1277 and 1473
- Between 1375 and 1571
- Between 1179 and 1571
Q22. The regression analysis shown below describes the relationship between the daily high temperature (in degrees Fahrenheit) and the number of pints of IPA beer consumed at Red Banjo Brewing.
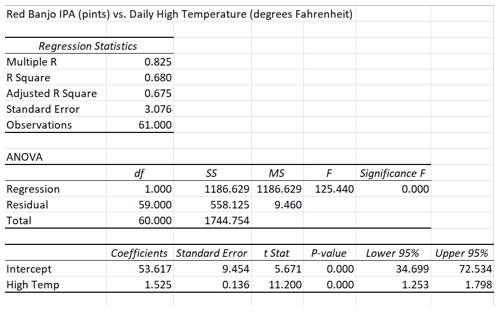
What do the values “1.253” and “1.798” for the variable High Temp tell us?
- There is a 95% chance that on average, each increase of one degree in the temperature will cause at least 1.253 extra pints of IPA to be consumed.
- There is a 95% chance that on average, each increase of one degree in the temperature will cause upwards of 1.798 extra pints of IPA to be consumed.
- At the 95% confidence level, it is plausible that the slope of the regression line is between 1.253 and 1.798
- At the 95% confidence level, it is plausible that the y-intercept of the regression line is between 1.253 and 1.798.
Q23. A management intern at Acme Multiplex Cinema is curious to see if there is a relationship between the theater’s daily revenue and the amount of bathroom tissue that is used by the customers. A sample of four weekends (12 days) yielded the scatterplot shown below.
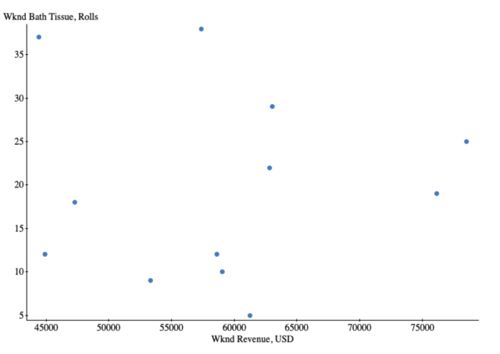
Which of the following statements best characterizes the relationship between revenue and bathroom tissue usage for Acme Multiplex Cinema?
- There appears to be no correlation.
- There is a strong nonlinear correlation.
- There is a strong negative correlation.
- There is a moderate linear correlation.
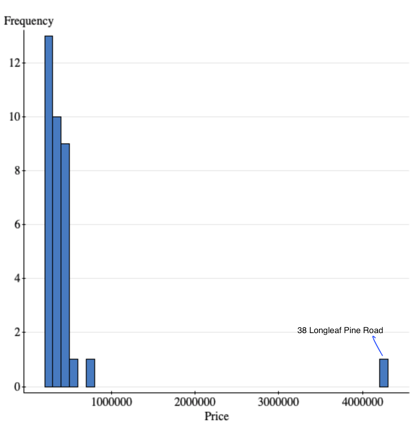
Q24. The selling prices of 35 properties in Brahminton are given in the attached file Data_Brahminton.xlsx. An agent wants to describe the set except for the property at 38 Longleaf Pine Road, which is listed at $4,254,300. Which of the following is true?
- The median list price of the remaining properties is $343,460
- The median list price of the remaining properties is $346,730.
- The median list price of the remaining properties is $350,000
- The median list price of the remaining properties is $358,258.
Q25. FlatCola Cybersystems is considering branching out into phone apps. If their development of a new app succeeds, the return on the product may be either large or small, depending on their ability to distinguish the app from their competitors. If the development does not succeed, it may still produce valuable innovations that would partially offset the costs of product development. The tree below summarizes the decision. The expected monetary value of the new venture is $1,288,000.
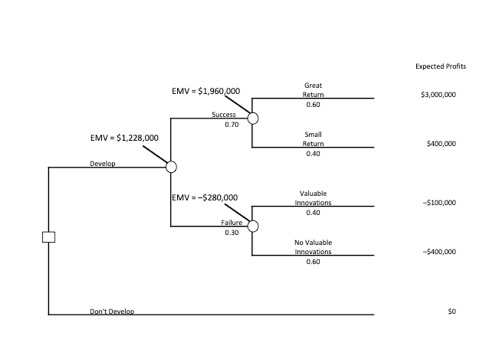
If the CEO decides not to pursue it, which is the best description of the CEO’s attitude toward risk?
- risk averse
- risk neutral
- risk seeking
- There is not enough information available to answer the question
Q26. The manager of Red Banjo Brewing Company must decide whether or not to launch a new sweet beer offering, Honey Ale. The success of Honey Ale depends greatly on how the public responds to a different kind of beer than they are used to. An initial decision analysis based on existing data concludes that the expected monetary value (EMV) of launching the new brew is $11,500. For $15,000, Red Banjo can hire a firm that will help them to learn more about how their customers might receive their new product. The EMV (assuming it is free) of buying this sample information for this decision is $25,000. The tree below summarizes Red Banjo’s decision.
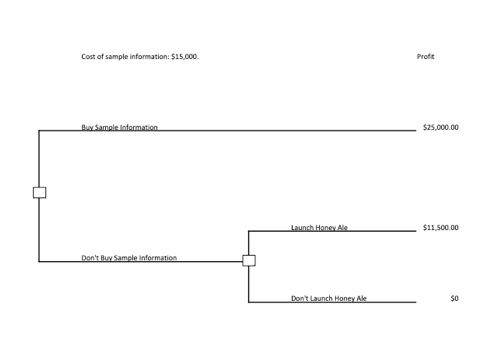
Based on EMV alone, what should the manager do?
- Hire the research firm
- Not hire the research firm, and launch Honey Ale
- Not hire the research firm, and not launch Honey Ale.
- There is not enough information to answer the question based on EMV alone.
Q27. FlatCola Cybersystems is considering branching out into phone apps. If their development of a new app succeeds, the return on the product may be either large or small, depending on their ability to distinguish the app from their competitors. If the development does not succeed, it may still produce valuable innovations that would partially offset the costs of product development. The decision tree is shown below.
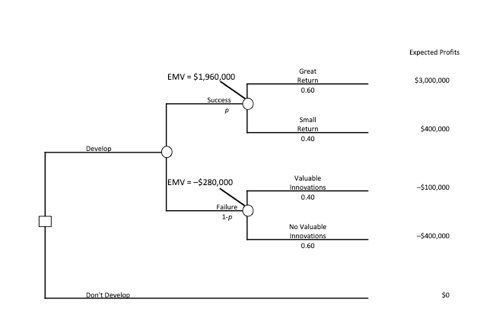
The CEO is nervous about the probability of a successful development. What are all the values of p, the probability of success, for which the expected monetary value indicates that the venture be profitable?
- p > 0.70
- p < 0.70
- p > 0.125
- p < 0.167
Q28. The regression analysis shown below characterizes the relationship between the daily number of customers at Acme Multiplex Cinemas and the total daily revenue in US dollars.
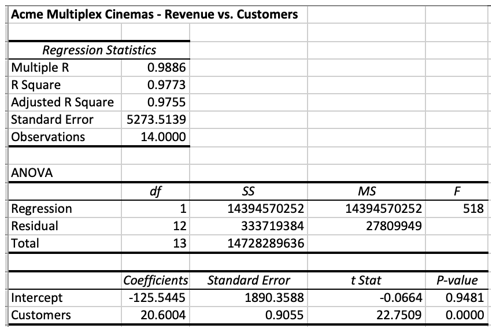
Which of the following statements cannot be inferred from the regression analysis?
- We can be 94.8% confident that on average, an increase in customers corresponds to an increase in revenue.
- On average, each increase in customers corresponds to an additional $20.60 in revenue.
- There is a nearly perfect linear correlation between the number of customers and the total revenue.
- Of the variability of daily revenue about its average value, 97.7% of the variation can be explained by the regression equation.
Q29. Dixie Do-nuts sells its doughnuts in several local convenience stores. They persuade one of the stores (Store 1) to place their product closer to the coffee machines. Their marketing department keeps daily logs of the number of doughnuts sold in Store 1 and a second store (Store 2) over a period of 5 weeks. A marketing specialist then tests the hypothesis that the average number of doughnuts sold in each store is the same. A computer output is shown below, where Donuts 1 and Donuts 2 represent the daily doughnut sales in Stores 1 and 2, respectively.
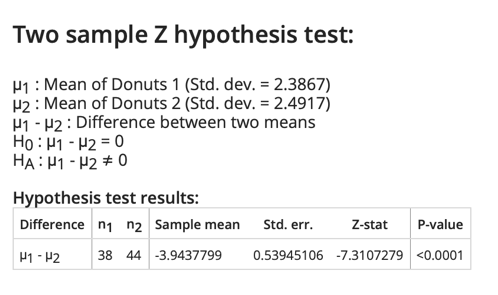
Which of the following is the best assessment of the test results, at a 0.05 significance level?
- More doughnuts were sold in Store 1 than in Store 2.
- The average doughnut sales in the two stores are different.
- There is a difference in sales, but it is not statistically significant.
- No conclusion can be drawn from the data.
Q30. The regression analysis below describes the relationship between selling price and house size for 35 of Ravenweyr Realty’s properties.
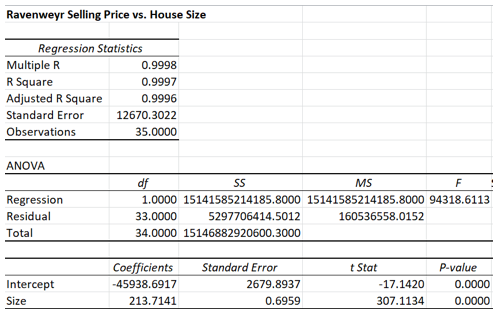
Which of the following is the best interpretation of the computer output?
- The P-values signify that there is zero correlation between house size and price
- The variability in house sizes accounts for exactly 99% of the variability in selling prices.
- The variability in house sizes accounts for 99.97% of the variability in selling prices.
- Ravenweyr would have to pay somebody to take a 200-square foot studio condo off their hands
Q31. The management intern at Acme Multiplex Cinema wants to predict the ticket sales of movies from their score at the rating site Razzberry.bizz. A sample of the weekend ticket sales for four films, with their Razzberry ratings, is shown below.
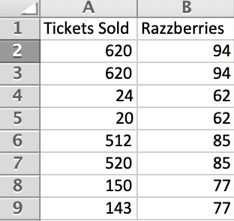
Which of the following regressions is correct using Razzberries as the independent variable and Tickets Sold as the dependent variable?
- Tickets Sold = 65 + 0.04*Razzberries
- Razzberries = 65 + 0.04*Tickets Sold
- Tickets Sold = –1266 + 20.03*Razzberries
- Razzberries = –1266 + 20.03*Tickets Sold
Q32. A regression analysis of 35 homes represented by Ravenweyr Realty yielded the following prediction equation Price = –32,526 – 617 * Time_To_Subway + 214 * Size where Price is the selling price in US dollars, Time_To_Subway is measured in minutes, and Size is interior floor space in square feet. Morgan wants to buy a home that has 1,500 square feet and is 10 minutes from the subway. Which is the best estimate of the home’s price?
- $175,304
- $282,304
- $347,356
- $895,114
Q33. The Community Realtors’ Association compiled a database of its members’ annual incomes. The results are shown in the histogram below.
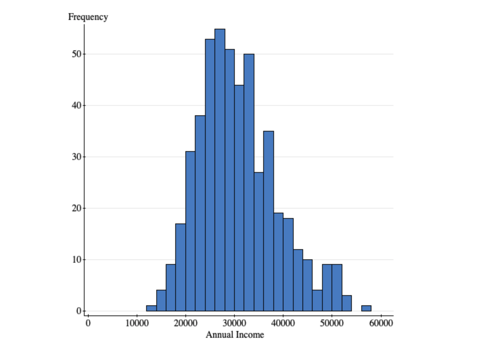
The association plans to sample its members next year to see if their incomes have changed. Which of the following best describes the distribution of the possible sample means?
- Skewed right
- Normal
- Skewed left
- Bimodal
Q34. The correlation coefficient between two variables is –1. Which of the following statements best describes the relationship between these two variables?
- It is weak and negative
- It is negative and linear.
- It is strong and nonlinear.
- It is weak and positive.
Q35. A statistics class of 200 students of Erewhon College was asked whether they thought the current quarantine rules were acceptable, or whether they were too strict. Each student was also asked whether they belonged to the “Wisdom” party or the “Beauty” party. The results are summarized below.

Which of the following statements cannot be inferred from this contingency table?
- Of the students who responded “Too Strict,” a majority belong to the Beauty party.
- The proportion of students who find the rules acceptable and belong to the Wisdom party is 42%.
- Of all students surveyed, 74.5% find the rules acceptable.
- 16% of all students belong to the Wisdom party and think the rules are too strict.
Q36. A public-interest group plans to survey a sample of Americans on their attitudes toward a single-payer health system. Which of the following questions is least likely to introduce bias into this survey?
- Whom do you want to handle your health care costs: your current insurance company or incompetent government bureaucrats?
- Would you prefer to have your health insurance from the government, or from wealthy for-profit corporations?
- Do you want to be forced to give up your current insurance provider?
- Do you favor switching from your current health insurance system to a single-payer system?
Q37. The regression analysis describes the relationship of sales of Red Banjo Lager (in pints) with the independent variables of the number of customers and the win-loss percentage of the local baseball team. Compare this multiple regression to the simple regressions with high temperature and number of customers as the independent variables.
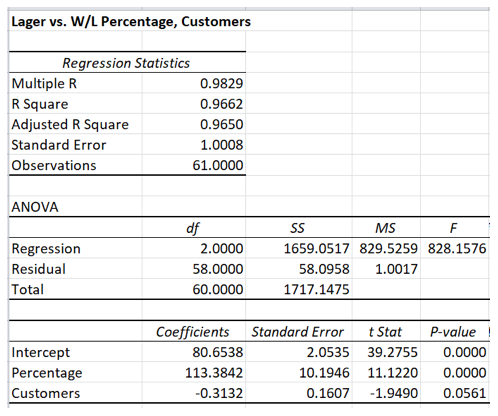
Which of the following is the most likely reason for the dramatic rise in the P-value for the number of customers in the multiple regression?
- Heteroscedasticity
- Homoscedasticity
- Multicollinearity
- Nonlinearity
Q38. A research firm told FlatCola Cybersystems that its favorability rating among customers had increased from last year’s rating of 9.1 (out of a possible 10). The fine print says that this conclusion is “statistically significant at the 0.05 level.” Which of the following is a correct interpretation of this statement?
I There is a 5% chance that the true rating is greater than 9.1.
II 5% of customers do not have a favorable opinion of FlatCola.
III There is a 5% chance that this conclusion is incorrect.
- I only
- II only
- III only
- I and II only
Q39. A quality assurance technician samples 9 bottles of Red Banjo Pilsner that are labeled as containing 12 fluid ounces of beer. The measurements are shown below.
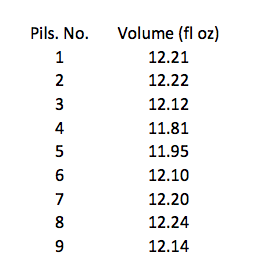
What is the mean volume per bottle for this sample?
- 11.95 ounces
- 12.04 ounces
- 12.11 ounces
- 12.14 ounces
Q40. A histogram showing the selling prices of 35 properties in Brahminton is presented below. The advertising department of one realtor notices that the property at 38 Longleaf Pine Road seems very different from the rest. Which of the following is the best description and response to this data point?
- It is an outlier and clearly is a mistake. Delete it from the graph.
- It is an outlier and clearly represents an outstanding property. Feature it as a typical Ravenweyr Realty offering.
- It is an outlier. Investigate what makes it different, but don’t delete it.
- It is the maximum value, but not an outlier. Don’t delete it.
Q41. Dixie Do-nuts is considering expanding from North Carolina into Tennessee, where the competing doughnut chain Gimme Sugar is based. A market research firm did a blind tasting study in each state to test the hypothesis that the proportion preferring Dixie Do-nuts to Gimme Sugar is the same in both places. The study finds that 54% of the 168 people surveyed in North Carolina prefer Dixie Do-nuts, while 49% of the 175 people surveyed in Tennessee prefer Dixie Do-nuts. Based on a 0.05 significance level, which of the following conclusions can be drawn?
- The study did not find a statistically significant difference in doughnut preferences between the two states
- More people prefer Dixie Do-nuts in North Carolina than in Tennessee
- The data prove that the alternative hypothesis is true.
- Expanding into Tennessee would be a waste of resources.
Q42. FlatCola Cybersystems must decide whether to develop a new security software suite. If the development succeeds, the return on the product may be large or small, depending on whether they can bring the completed product to market ahead of their competitors, allowing them to dominate the market. If the development does not succeed, it may still produce valuable innovations that would partially offset the costs of product development. The tree below summarizes the decision.
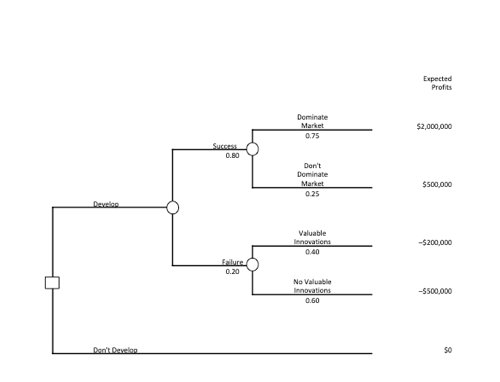
What is the expected monetary value of developing the new software?
- $1.502 million
- $1.324 million
- $1.224 million
- $1.200 million
Q43. An analysis of advertising expenses and gross sales for FlatCola Cybersystems produced the following regression equation: Sales = 684,402 + 84.623*Advertising, where both Sales and Advertising are measured in dollars. In a month in which $12,500 is spent on advertising, what is the average amount predicted for the company’s gross sales (rounded to the nearest hundred)?
- $84,600
- $685,500
- $1,742,200
- $8,555,100
Q44. The regression analysis below relates the selling price of homes (in US dollars) to travel time to the subway (in minutes) and size (in square feet of interior floor space) for 35 selected properties
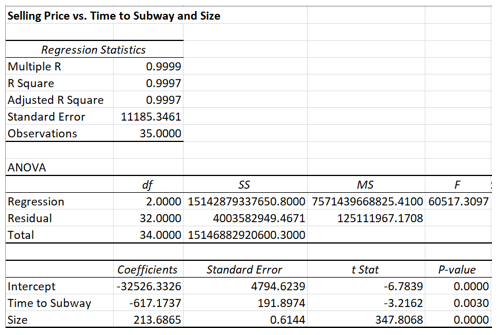
Which of the two independent variables is statistically significant at the 0.05 level?
- Time to subway only
- Size only
- Both independent variables
- Neither independent variable
Please click on Make Payment to get all correct answers at $50 (No Hidden Charges or any Sign Up Fee). In description, please don’t forget to mention the exam name – Harvard Quantitative Methods Final Assessment Test 1. We will send the correct answers at your email id within an hour.
