Online Coursework Help » Online Exam Help » Harvard Quantitative Methods Pre-Assessment
Harvard Quantitative Methods Pre-Assessment
Q1. The asking prices of several homes represented by Ravenweyr Realty are listed below.
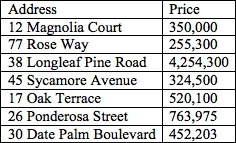
Which of the following statements is not true?
- Six of the seven homes have a price that is lower than the mean asking price
- The median asking price is approximately $452,000
- The mean asking price is approximately $1.0 million
- Six of the seven homes have a price that is lower than the median asking price
Q2. A regression analysis produced the following relationship among listing price (in dollars), house size (in square feet), and distance to the local commuter train (in minutes) for homes in Brahminton:
Price = 75,000 + 410*Size – 2050*Distance
According to this model, what is the estimated price of a 1500-square-foot home that is 10 minutes away from the commuter train?
- $594,500
- $669,500
- $710,500
- $3,075,000
Q3. Red Banjo Brewing is considering launching a sweet beer called “Honey Ale.” They are concerned that their customers may not accept the product, as it would be the first locally produced sweet beer. An initial decision analysis based on available data shows that the expected monetary value (EMV) of marketing Honey Ale is –$20,000. The EMV of buying perfect information about the consumer response is $30,000. A market research company offers to do a study for Red Banjo for $10,000. Although its information is not perfect, the sample study should offer some information about the response to the new brew.
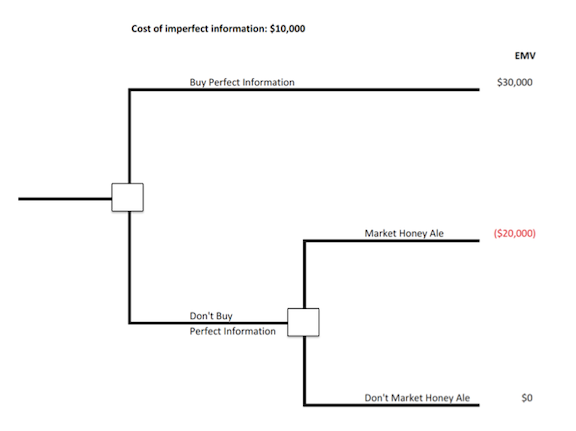
What should Red Banjo’s management do, based on EMV?
- Neither buy the research firm’s sample information nor market Honey Ale
- Buy the research firm’s sample information
- Market Honey Ale instead of buying the research firm’s sample information
- There is not enough information available to answer the question
Q4. Scores on an intelligence test are reported to follow a normal distribution, with a mean of 100. Approximately what proportion of scores will fall within two standard deviations of the mean?
- 68%
- 95%
- 99.9%
- 50%
Q5. Red Banjo Brewing Company produces 12-ounce cans of Porter and 18-ounce cans of IPA. 25 cans of each brew are selected at random, and the volume of beer in each can is measured. A summary of the results is shown below
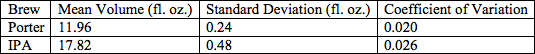
Which statement best compares the variability in the volume of the two brews?
- The IPA is more variable, because its coefficient of variation is larger
- The IPA is more variable, because its standard deviation is larger.
- The IPA is more variable, because it is 0.18 ounce short of 18 ounces, while the Porter is only 0.04 ounces short of its represented volume.
- The Porter and the IPA have the same variability.
Q6. Last month, Red Banjo Brewing found that the average bottle of IPA contained 17.82 ounces of beer, though it was advertised as containing 18 ounces. After its vendor adjusted the bottling equipment, a sample of 36 bottles yielded a mean volume of 18.02 ounces, with a standard deviation of 0.31 ounces
Assuming a 95% confidence level, which of the following does the new measurement support?
- This month, the mean volume of 18-ounce IPA is 17.82 ounces
- This month, the mean volume of 18-ounce IPA bottles is 18.00 ounces
- The average volume of 18-ounce IPA bottles is still less than 18 ounces
- There is not enough information to conclude that the volume has changed
Q7. After a national recall of tainted ground beef, a polling firm conducts a survey to determine whether the public favors increased governmental oversight of food producers.
Which of the following questions will deliver an unbiased response?
- Do you support continued restrictive and expensive agribusiness regulations?
- In view of recent failures to keep our food supply safe, should the government crack down on unscrupulous meat producers?
- Would you like to have more oversight of the corporations that sell your family’s food?
- None of the above
Q8. A manager at the Acme Multiplex Cinema wanted to find explanatory variables that would predict weekly revenues. An intern created a regression analysis that predicted Revenue = 7914.71+2020.72 * Bath Tissue, where Revenue is a night’s gross income and Bath Tissue is the number of rolls of bathroom tissue that are used that night. A second analysis, including the number of customers, predicted Revenue = –42.34 + 119.1* Bath Tissue + 18.78*Customers
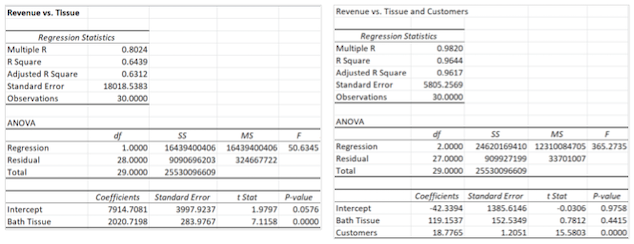
Which of the following can be concluded from the P-values “0.0000” and “0.4415” for the variable “Bath Tissue”?
I. Adding another independent variable increased the P-value of Bath Tissue.
II. Bath Tissue is a proxy variable for the number of customers.
III. The variables Bath Tissue and Customers appear to be collinear.
- I only
- II only
- III only
- I, II and III
Q9. The regression analysis below shows the relationship between consumption of beer at Red Banjo Brewing (in pints) and the presence (or absence) of a live band at the brewpub.
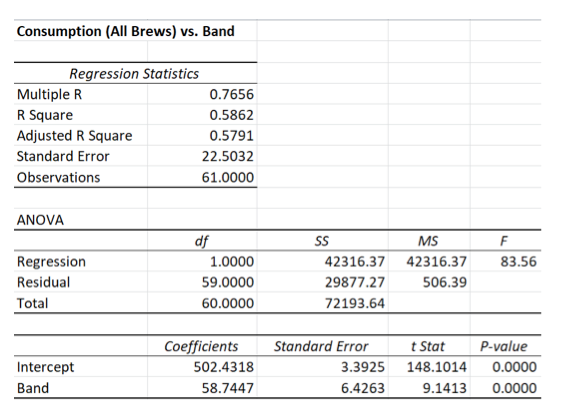
What does the coefficient “58.7447” signify?
- On average, about 59 more people visit the brewpub when a band is playing
- The presence of a band explains about 58.74% of the variation in the consumption of beers.
- On average, about 59 fewer pints of beer are sold when there is a band playing.
- On average, about 59 more pints of beer are sold when there is a band playing.
Q10. The regression analysis below describes the relationship between monthly sales (in thousands of dollars), monthly advertising expenses (in thousands of dollars), and the number of people on a firm’s sales staff.
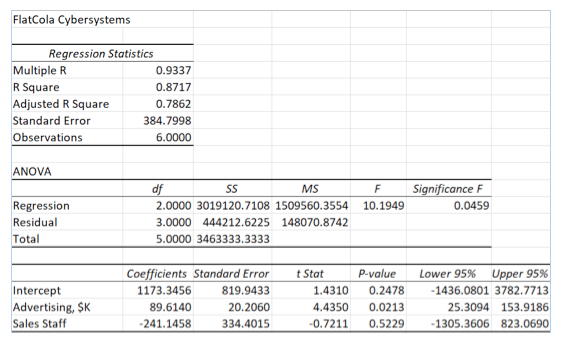
Which of the following statements about the coefficient “–241.1458” is true?
- For each additional salesperson added, the average monthly sales decreased by about $241,000
- For each additional salesperson added, when controlling for the variation in advertising expenditures, the average monthly sales decreased by about $241,000.
- It is plausible that the average monthly sales do not have a significant association with the number of salespeople.
- None of the above.
Q11. The ages of employees of FlatCola Cybersystems, a small software firm, are shown below.
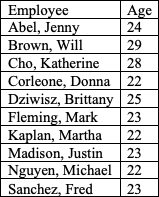
What is the mean age of the employees?
- 22
- 23
- 24.1
- 25.2
Q12. Choose the option to correctly complete the following sentence. The Central Limit Theorem says that the distribution of ______________ is normal regardless of the underlying population distribution.
- sample means
- sample medians
- sample standard deviations
- sample variances
Q13. The regression analysis shown below describes the relationship between the daily temperature (in degrees Fahrenheit), in May and June, and the consumption of IPA (in pints) sold at Red Banjo Brewing
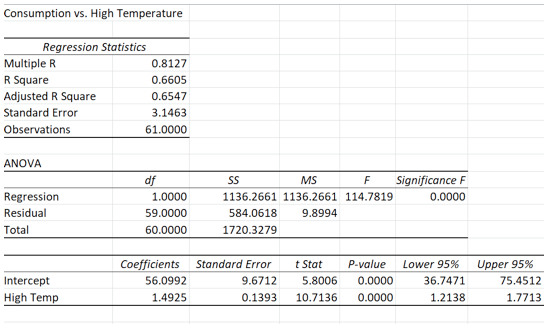
At which significance level is the relationship between temperature and consumption statistically significant?
- 0.10
- 0.05
- 0.01
- All of these
Q14. The regression analysis below shows the relationship between revenue and the number of customers for Acme Multiplex Cinema. Which of the following can be concluded from the analysis results?
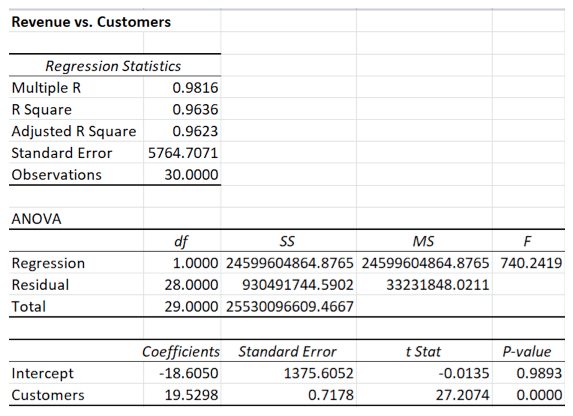
- The R-squared value of approximately 96% shows a strong linear relationship between the variables
- About 96.4% of all customers are satisfied with the service they received at Acme Multiplex.
- The P-value “0.0000” indicates there is no significant relationship between revenue and the number of customers.
- We have 96% confidence that the revenue is related to the number of customers
Q15. The owners of Red Banjo Brewing are considering launching a sweet beer called “Honey Ale.” They are concerned that their customers may not accept the product, but are confident that they will be successful if they can get some early tasters to give their beer some positive local press coverage. The decision tree for their analysis is below.
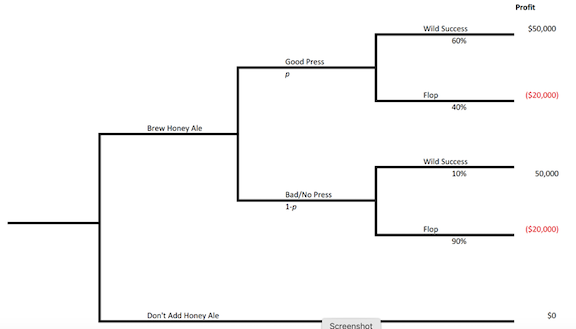
For what values of p = Prob(Good Press) would launching Honey Ale be preferable to not launching the brew, based on expected monetary value (EMV)?
- p > 0.371
- p > 0.600 only
- p > 0.729 only
- There is not enough information available to answer the question
Q16. An owner of Red Banjo Brewing Co. selects ten 12-ounce cans of Red Banjo Stout and measures the volume of beer in each can. The results are shown below.
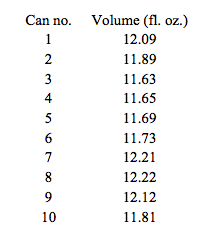
Which of the following statements is true?
I. The average volume of the ten cans is at least 12.0 ounces.
II. At least half the cans have a volume of at least 12.0 ounces.
III. At least half the cans have a volume of less than 12.0 ounces.
- I only
- II only
- III only
- None of the above
Q17. The heights in inches of the five starting players for two college teams, the Jets and the Rockets, are given below
Jets: 76, 78, 78, 78, 80
Rockets: 72, 74, 78, 82, 84
Which of the following statements about the players’ heights are true?
I. The teams have the same standard deviation, because they have the same average height.
II. The Rockets have a larger standard deviation, because there is a greater difference between the tallest and shortest heights.
III. The Jets have a smaller standard deviation, because the heights are more closely clustered around the average height.
- I only
- II only
- III only
- None of the above
Q18. A large company is concerned about morale and wants to assess employees’ satisfaction with their work environments. Which of the following is the best way to get useful data?
- Hire a third-party firm to select 500 employees at random, send them a questionnaire in the mail, and follow up if there is no response.
- Send a questionnaire to each manager and direct the manager to get employees’ responses at their next weekly staff meeting
- Send a questionnaire by email to each full-time employee and request a response
- Select 500 employees at random and phone them during their workday
Q19. A quality assurance manager is planning a study on the dimensions of one of their manufactured products. When calculating a confidence interval for the mean, which of the following measures will reduce the width of the confidence interval?
- Decreasing the sample size
- Increasing the sample size
- Increasing the confidence level
- None of the above
Q20. The regression analysis below shows the relationship among consumption of beer at Red Banjo Brewing IPA (in pints), the day’s high temperature, and the previous day’s high temperature (both in degrees Fahrenheit).
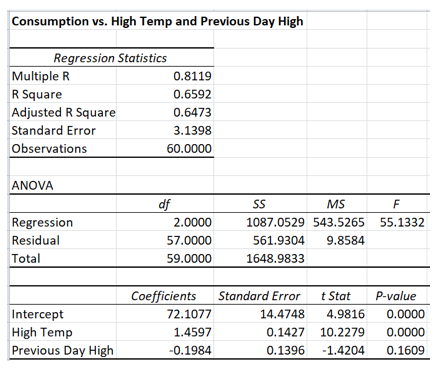
What type of variable is “Previous Day High” in this analysis?
- A dependent variable
- An outcome variable
- A lagged variable
- None of the above
Q21. The regression analysis shown below describes the relationship between the daily temperature (in degrees Fahrenheit), in May and June, and the consumption of IPA (in pints) sold at Red Banjo Brewing.
Which of the following would be a reasonably accurate prediction?
- If today’s high temperature is 70 degrees, the brewpub will sell about 125.8 pints of IPA
- If today’s high temperature is 70 degrees, the brewpub will sell about 104.5 pints of IPA
- If today’s high temperature is 70 degrees, the brewpub will sell about 160.5 pints of IPA
- If today’s high temperature is 70 degrees, the brewpub will sell about 56.1 pints of IPA.
Q22. Choose the option to correctly complete the sentence.
The selling prices of seven homes represented by Ravenweyr Realty are shown below
The price of 38 Longleaf Pine Road is an outlier that will pull the _________ far from the other values
- median
- standard deviation
- coefficient of variation
- mean
Q23. FlatCola Cybersystems analyzed the relationship between its monthly advertising expenses and monthly sales over the last two quarters, and obtained the equation SALES = 685,000 + 85*ADVERTISING, with a correlation coefficient of r = 0.92. During that period, the advertising expenses varied between $10,000 and $35,000.
The advertising manager says they should spend $50,000 on advertising every month next year, expecting a result of at least $4,935,000 in monthly sales. Which of the following is the best response?
- No. We don’t know that advertising influences our sales
- No. We can’t extrapolate our analysis to such a large increase in advertising
- Sure! We can expect almost $5,000,000 in sales
- None of the above is a good response
Q24. A quality assurance engineer is concerned that the total length of some manufactured bolts may be less than the prescribed 10.5 centimeters. She selects 100 bolts at random and measures their lengths.
- µ ≥ 10.5
- µ < 10.5
- µ > 10.5
- µ = 10.5
What is the best formulation of the null hypothesis for this test?
Q25. Which of the following is not true of the normal distribution?
- It is symmetric
- It is completely described by its mean and standard deviation.
- It has a finite range of values
- The mean is the same as the median
Q26. A political research firm is asked to find out whether men and women feel differently about their client candidate. In a survey of 412 men, 59% had a favorable impression of the candidate. A survey of 446 women showed 65% had a favorable impression of the candidate.
At a 95% confidence level, what conclusion should the research firm draw?
- Women are more likely than men to have a favorable impression
- Men and women are about equally likely to have a favorable impression
- Men are more likely than women to have a favorable impression
- There is insufficient evidence to conclude that men and women feel differently
Q27. A survey was conducted at a local store and 400 randomly-chosen customers were asked about their shopping habits. Some of the demographic data are summarized below:
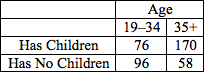
If one of these customers is selected at random, what is the probability (to the nearest tenth of a percent) that the customer is 35 or older and does not have children?
- 58.0%
- 37.7%
- 25.4%
- 14.5%
Q28. A scatterplot showing weight in pounds against height in inches, for a sample of first-year female students, is shown below.
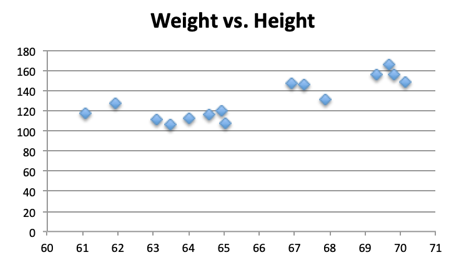
Which is a plausible value of the correlation coefficient between weight and height?
- -0.96
- 0.5
- 0.84
- 1.0
Q29. A random sample of 100 cans of Red Banjo Porter has a mean volume of 11.96 ounces and standard deviation of 0.2 ounces. Which of the following is a 95% confidence interval for the population mean?
- [11.9, 11.96]
- [11.956, 11.964]
- [11.92, 12.00]
- [12.00, 12.04]
Q30. The scatter diagram and regression line below describe the relationship between monthly advertising expenses (in dollars) and monthly sales (in dollars). Which of the following statements defines residual errors?
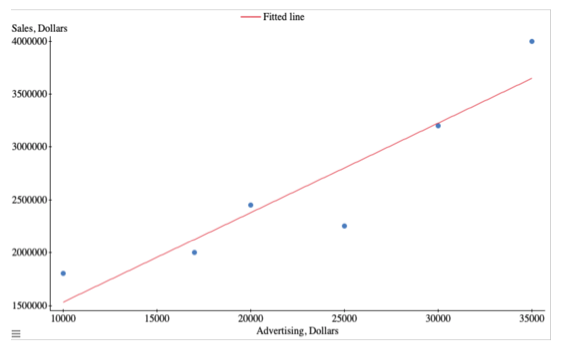
- The vertical distances from the data points to the horizontal axis
- The vertical distances from the data points to the regression line
- The shortest distances from the data points to the regression line
- The shortest distances from each data point to its nearest neighbor
Q31. Taylor plans to open a florist shop, Elegance, either in town or at his home. Taylor knows that if the shop is opened in town, another local florist may open a competing store. Taylor is risking his goodwill by opening the shop in town, rather than at home. The decision tree is shown below.
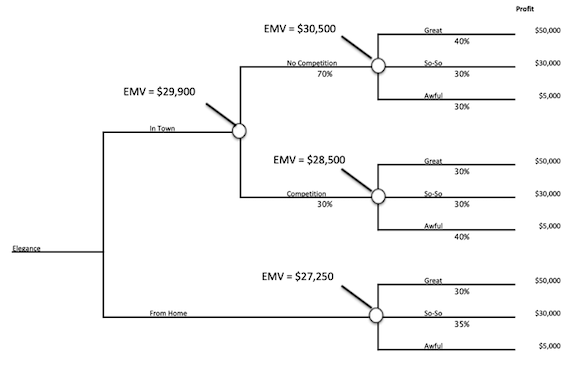
If Taylor decides to open the shop at home, which of the following best describes his attitude towards risk involved with this decision?
- Risk seeking
- Risk neutral
- Risk averse
- Prudent
Q32. A survey was conducted at a local store and 400 randomly-chosen customers were asked about their shopping habits. Some of the demographic data are summarized below:
What is the conditional probability (to the nearest percent) that a customer is aged 19–34, given that the customer does not have children?
- 24%
- 56%
- 62%
- 96%
Q33. The marketing consultant for FlatCola Cybersystems wants to know if the firm’s name recognition has increased as a result of a recent advertising campaign. Last year, a survey showed that 49% of potential customers said they had heard of FlatCola. In a survey of 408 potential customers held this year, 54% indicated that they had heard of FlatCola.
Assuming a 95% confidence level and using a one-sided hypothesis test, which of the following conclusions should the campaign draw?
- The data support the alternative hypothesis: the proportion of potential customers who recognize the name has increased.
- The data support the null hypothesis: the proportion of potential customers who recognize the name has not increased.
- The data show that this year’s results and last year’s results are in a statistical tie
- There is insufficient information to answer this question
Q34. Consider the data in the scatterplot below.
Which of the following statements cannot be true?
I. The data show a correlation coefficient of 0.
II. The variables have a strong relationship.
III. The variables have a strong linear relationship.
- I only
- II only
- III only
- None of the above
Q35. A survey was conducted at a local store and 400 randomly-chosen customers were asked about their shopping habits. Some of the demographic data are summarized below:
Which of the following statements is true?
- The data directly implies that older customers have more children
- Knowing if a customer has children gives no information about their age
- Knowing a customer’s age gives information about whether or not they have children
- None of the above.
Q36. Choose the option to correctly complete the sentence. Heaven County asked a random sample of 625 residents whether they approved of building a new road across the county. Of those surveyed, 9% approved and 91% disapproved. A 95% confidence interval for the proportion of residents who approved of the new road is:
- [6.7%; 11.2%]
- [2.0%; 16%]
- [81%; 99%]
- There is not enough information given to calculate the confidence interval.
Q37. The regression analysis shown below describes the relationship between the daily temperature (in degrees Fahrenheit), in May and June, and the consumption of IPA (in pints) sold at Red Banjo Brewing. Which of the following statements is accurate?
- If the high temperature increases by 1.49 degrees, average IPA consumption will increase by 1 pint
- If the high temperature increases by 56.10 degrees, average IPA consumption will increase by 1 pint.
- If the high temperature increases by 1 degree, average IPA consumption will increase by 1.49 pints
- If the high temperature increases by 1 degree, average IPA consumption will increase by 56.10 pints
Q38. Taylor plans to open a florist shop, Elegance, either in town or at his home. If the shop is opened in town, Taylor estimates there is a 30% chance that another, more established florist will open a competing shop nearby, lessening the probabilities that Taylor will do a “great” business. The tree below summarizes Taylor’s decision
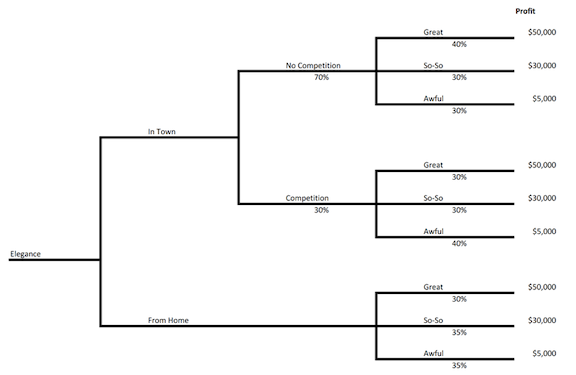
What is the expected monetary value of opening the shop in town?
- $21,350
- $28,300
- $29,150
- Not enough information is given to answer this question
Q39. Choose the option to correctly complete the sentence.
A random sample of 9 bottles of Red Banjo Pilsener has a mean volume of 12.11 ounces and a standard deviation of 0.14 ounces.
A 95% confidence interval for the population mean is:
- [12.02 ounces; 12.20 ounces]
- [12.00 ounces; 12.22 ounces]
- [11.83 ounces; 12.39 ounces]
- None of the above
Q40. A consumer advocate plans to sample monthly bills from the electric company in order to estimate the average amount (in dollars) that households spend on electricity. Previous studies suggest that the standard deviation of the charges is approximately $100.
In order to calculate a 95% confidence interval with total width of $10, how many receipts should the researcher include in her/his sample?
- 400
- 40
- 1200
- 1600
Q41. FlatCola Cybersystems analyzed the relationship between its monthly advertising expenses and monthly sales over the last two quarters, and obtained the equation SALES = 685,000 + 85*ADVERTISING, with a correlation coefficient of r = 0.92. The R-Squared value is 86.4%.
Based on these measures, which of the following statements is correct?
- The variation in monthly advertising expenses explains about 86% of the variation in sales.
- Predictions about sales will be correct within an 86% confidence interval
- The variation in monthly advertising expenses explains about 92% of the variation in sales
- Predictions about sales will be correct within a 92% confidence interval
Q42. Taylor plans to open a florist shop, Elegance, either in town or at his home. Taylor knows that if the shop opens in town, another local florist may open a competing store. Taylor is risking his goodwill by opening the shop in town, rather than at home. The decision tree is shown below.
On the basis of expected monetary value (EMV), for what cost of lost goodwill would opening the shop at home be preferable to opening the store in town?
- Lower than $1,900
- Higher than $1,900
- Lower than $3,150
- Higher than $3,150
Q43. Which of the following is not true of the normal distribution?
- It provides a useful description of many real-world data sets
- It is bimodal.
- Its mean is always equal to its median.
- 95% of the area under the curve lies within two standard deviations of the mean
Please click on Make Payment to get all correct answers at $40 (No Hidden Charges or any Sign Up Fee). In description, please don’t forget to mention the exam name – Harvard Quantitative Methods Pre-assessment. We will send the correct answers at your email id within an hour.