Home » Accounting Assignment Help » Managerial Accounting Assignment Help » Connect Managerial Accounting Chapter 13
Connect Managerial Accounting Chapter 13
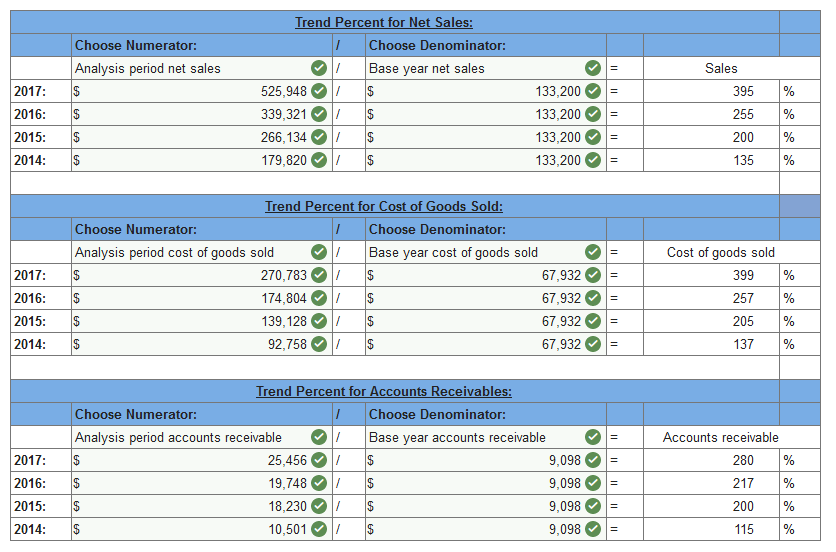
Q1. Compute trend percents for the above accounts, using 2013 as the base year.
| 2017 | 2016 | 2015 | 2014 | 2013 | |
| Sales | $525,948 | $339,321 | $266,134 | $179,820 | $133,200 |
| Cost of goods sold | 270,783 | 174,804 | 139,128 | 92,758 | 67,932 |
| Accounts receivable | 25,456 | 19,748 | 18,230 | 10,501 | 9,098 |
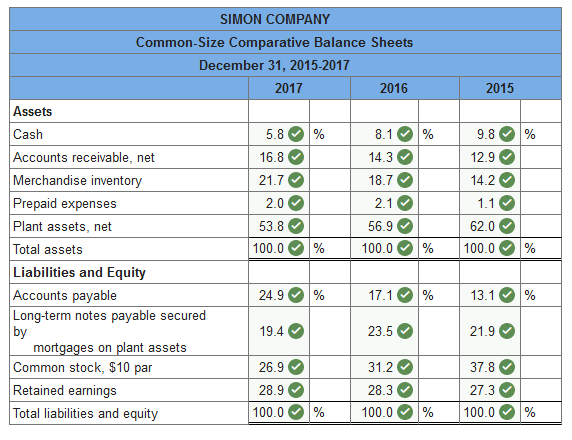
Q2. Simon Company’s year-end balance sheets follow.
| At December 31 | 2017 | 2016 | 2015 |
| Assets | |||
| Cash | $35,199 | $42,404 | $42,438 |
| Accounts receivable, net | 102,017 | 74,941 | 56,013 |
| Merchandise inventory | 132,193 | 98,058 | 61,486 |
| Prepaid expenses | 11,913 | 11,021 | 4,715 |
| Plant assets, net | 327,441 | 298,372 | 268,348 |
| Total assets | $608,763 | $524,796 | $433,000 |
| Liabilities and Equity | |||
| Accounts payable | $151,582 | $89,577 | $56,584 |
| Long-term notes payable secured by mortgages on plant assets |
117,881 | 123,117 | 94,736 |
| Common stock, $10 par value | 163,500 | 163,500 | 163,500 |
| Retained earnings | 175,800 | 148,602 | 118,180 |
| Total liabilities and equity | $608,763 | $524,796 | $433,000 |
Express the balance sheets in common-size percents. (Do not round intermediate calculations and round your final percentage answers to 1 decimal place.)
Q3. Simon Company’s year-end balance sheets follow.
| At December 31 | 2017 | 2016 | 2015 |
| Assets | |||
| Cash | $24,465 | $28,886 | $30,403 |
| Accounts receivable, net | 70,906 | 49,539 | 41,356 |
| Merchandise inventory | 88,251 | 66,799 | 43,167 |
| Prepaid expenses | 8,038 | 7,583 | 3,446 |
| Plant assets, net | 227,185 | 208,266 | 191,828 |
| Total assets | $418,845 | $361,073 | $310,200 |
| Liabilities and Equity | |||
| Accounts payable | $105,335 | $61,632 | $41,356 |
| Long-term notes payable secured by mortgages on plant assets |
80,318 | 80,555 | 68,554 |
| Common stock, $10 par value | 162,500 | 162,500 | 162,500 |
| Retained earnings | 70,692 | 56,386 | 37,790 |
| Total liabilities and equity | $418,845 | $361,073 | $310,200 |
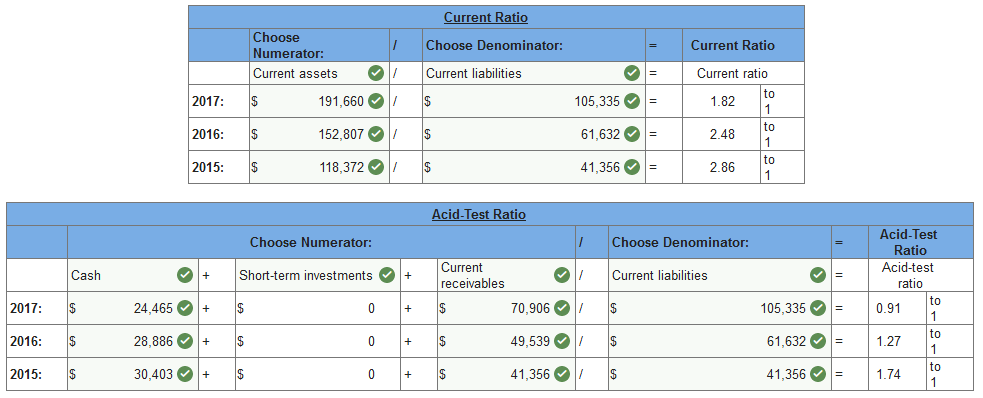
- Compute the current ratio for the year ended 2017, 2016, and 2015.
- Compute the acid-test ratio for the year ended 2017, 2016, and 2015.
Q4. Simon Company’s year-end balance sheets follow.
| At December 31 | 2017 | 2016 | 2015 | ||||||
| Assets | |||||||||
| Cash | $ | 31,000 | $ | 34,600 | $ | 37,000 | |||
| Accounts receivable, net | 89,900 | 63,800 | 57,200 | ||||||
| Merchandise inventory | 101,746 | 83,200 | 59,900 | ||||||
| Prepaid expenses | 10,175 | 9,545 | 3,512 | ||||||
| Plant assets, net | 292,179 | 258,855 | 152,388 | ||||||
| Total assets | $ | 525,000 | $ | 450,000 | $ | 310,000 | |||
| Liabilities and Equity | |||||||||
| Accounts payable | $ | 134,647 | $ | 78,332 | $ | 40,102 | |||
| Long-term notes payable secured by mortgages on plant assets |
96,726 | 106,605 | 69,880 | ||||||
| Common stock, $10 par value | 162,500 | 162,500 | 162,500 | ||||||
| Retained earnings | 131,127 | 102,563 | 37,518 | ||||||
| Total liabilities and equity | $ | 525,000 | $ | 450,000 | $ | 310,000 | |||
The company’s income statements for the years ended December 31, 2017 and 2016, follow.
| For Year Ended December 31 | 2017 | 2016 | ||||||||||
| Sales | $ | 682,500 | $ | 535,500 | ||||||||
| Cost of goods sold | $ | 416,325 | $ | 348,075 | ||||||||
| Other operating expenses | 211,575 | 135,482 | ||||||||||
| Interest expense | 11,603 | 12,317 | ||||||||||
| Income taxes | 8,873 | 8,033 | ||||||||||
| Total costs and expenses | 648,376 | 503,907 | ||||||||||
| Net income | $ | 34,124 | $ | 31,593 | ||||||||
| Earnings per share | $ | 2.10 | $ | 1.94 | ||||||||
Additional information about the company follows.
| Common stock market price, December 31, 2017 | $33.00 | |
| Common stock market price, December 31, 2016 | 31.00 | |
| Annual cash dividends per share in 2017 | 0.24 | |
| Annual cash dividends per share in 2016 | 0.12 |
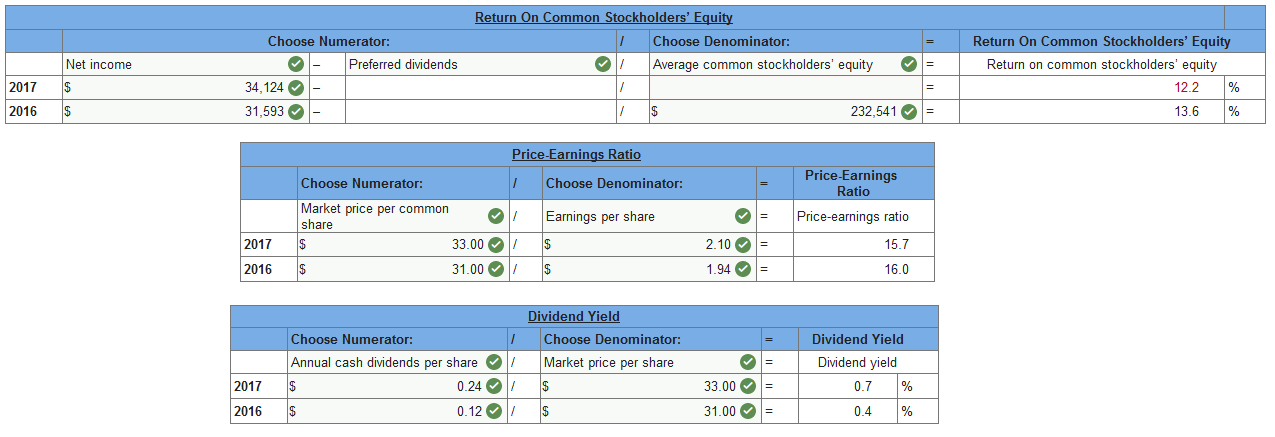
To help evaluate the company’s profitability, compute the following ratios for 2017 and 2016:
-
- Return on common stockholders’ equity.
- Price-earnings ratio on December 31.
- Dividend yield.
Connect Managerial Accounting Chapter 13 Quiz
Q1. Industry standards for financial statement analysis:
- Are based on a single competitor’s financial performance.
- Are set by the government.
- Are available for the financial performance and condition of the company’s industry.
- Are based on rules of thumb.
- Compare a company’s income with its prior year’s income.
Q2. The market price of Horokhiv Corporation’s common stock at the start of 2016 was $47.50 and it declared and paid cash dividends of $3.28 per share. The Dividend yield ratio is:
- 14.5%
- 7.4%
- 6.5%
- 144.8%
- 6.9%
Q3. The dollar change for a comparative financial statement item is calculated by:
- Subtracting the analysis period amount from the base period amount.
- Subtracting the base period amount from the analysis period amount.
- Subtracting the analysis period amount from the base period amount, dividing the result by the base period amount, then multiplying that amount by 100.
- Subtracting the base period amount from the analysis period amount, dividing the result by the base period amount, then multiplying that amount by 100.
- Subtracting the base period amount from the analysis amount, then dividing the result by the base amount.
Q4. Internal users of financial information:
- Are not directly involved in operating a company.
- Are those individuals involved in managing and operating the company.
- Include shareholders and lenders.
- Include directors and customers.
- Include suppliers, regulators, and the press.
Q5. A corporation reported cash of $27,000 and total assets of $461,000 on its balance sheet. Its common-size percent for cash equals:
- 17.1%
- 58.6%
- 100%
- 5.86%
- 17.07%
Q6. Refer to the following selected financial information from Graceworks, Corp. Compute the company’s days’ sales in inventory for Year 2. (Use 365 days a year.)
| Year 2 | Year 1 | |||
| Merchandise inventory | 271,000 | 253,500 | ||
| Cost of goods sold | 486,400 | 433,100 |
- 203.4
- 228.4
- 179.5
- 215.1
- 113.3
Q7. Jones Corp. reported current assets of $193,000 and current liabilities of $137,000 on its most recent balance sheet. The working capital is:
- 141%
- 71%
- ($56,000)
- $56,000
- 41%
Q8. All of the following are true of a financial statement analysis report, except:
- Contains ambiguities and qualifications.
- Forces preparers to organize their reasoning and to verify the logic of analysis.
- Serves as a method of communication to users.
- Helps users and preparers to refine conclusions based on evidence from key building blocks.
- Enables readers to see the process and rationale of analysis.
Q9. To compute trend percentages the analyst should:
- Select a base period, assign each item in the base period statement a weight of 100%, and then express financial numbers from other periods as a percent of their base period number.
- Subtract the analysis period number from the base period number.
- Subtract the base period amount from the analysis period amount, divide the result by the analysis period amount, then multiply that amount by 100.
- Compare amounts across industries using Dun and Bradstreet.
- Compare amounts to a competitor.
Q10. A corporation reported cash of $14,000 and total assets of $178,300 on its balance sheet. Its common-size percent for cash equals:
- .0785%
- 7.85%
- 12.73%
- 1273%
- 78.50%
Please contact us via live chat if you face difficulty in any of the question or exercise.